The Worst US States for Getting Stuck in Traffic from Accidents and Construction
I have long been interested in the experiences of driving across the United States. Almost everyone I have met has their own anecdotes about how bad certain states are for drivers.
- “There is so much construction in Pennsylvania!”
- “Arizona drivers are reckless!”
- “Jersey drivers are THE WORST.”
I decided to pull available data for a slightly tongue-in-cheek exercise to determine which US states actually are most unpleasant for drivers.
Data
I found two interesting datasets on Kaggle:
Assembled by Sobhan Moosavi and their research team:
Moosavi, Sobhan, et al. “A Countrywide Traffic Accident Dataset.” 2019.
To normalize fairly, I used the Federal Highway Administration’s road length data — so we compare events per 100 miles of lane rather than raw counts:
Analysis approach
A few important notes:
- Only 2021 data is used. Collection methods improved each year, making year-over-year trends unreliable.
- Alaska and Hawaii excluded due to data availability.
- Highway vs. surface-street classification is approximate (based on road name patterns).
1. Which states have the most traffic events per 100 miles of road?
Starting with raw totals (reality check):
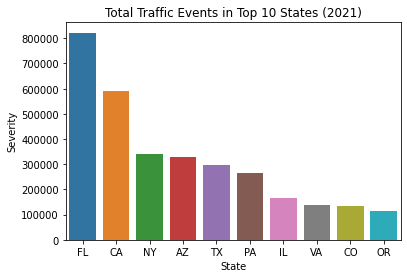 Total count of traffic events by state in 2021
Big states lead the way — and Pennsylvania ranks just behind Texas. Now normalized to events per 100 miles of lane:
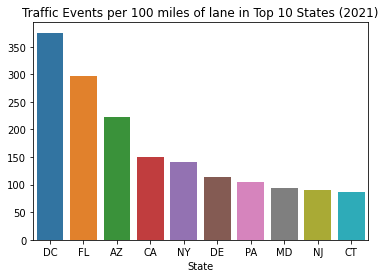 Traffic event occurrence per 100 miles of road by state in 2021
Washington D.C. leads by a wide margin. Florida, California, and New York follow. Weighting by severity doesn’t change rankings meaningfully:
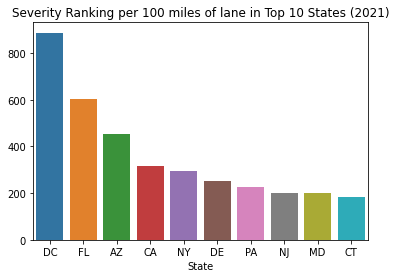 Traffic events per 100 miles, weighted by severity, 2021
Breaking it down into accidents vs. construction:
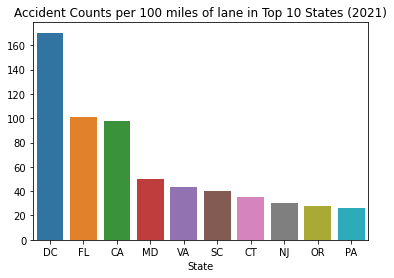 Accidents per 100 miles of road by state in 2021
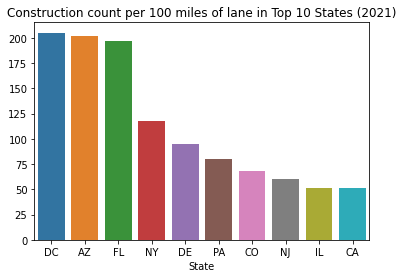 Construction per 100 miles of road by state in 2021
And looking at all 49 states/DC:
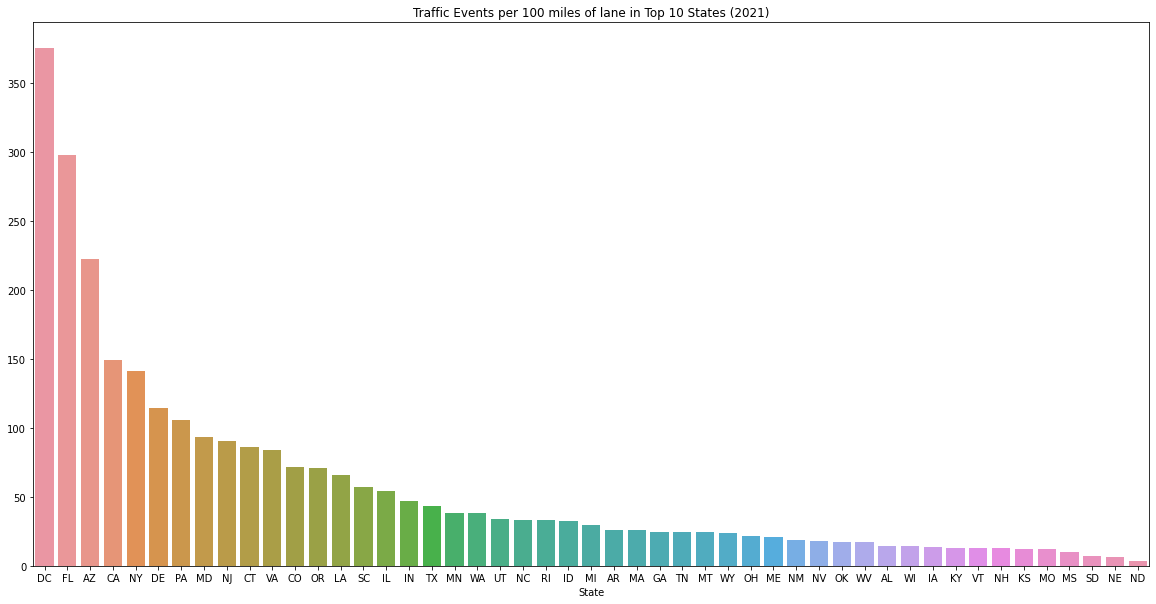 Traffic events per 100 miles of road, all states, 2021
2. Highway vs. surface street differences
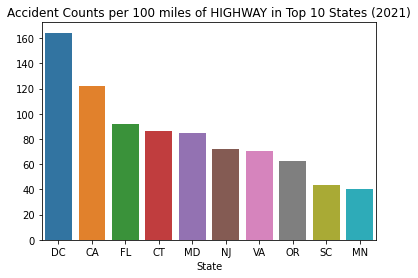 Accidents per 100 miles of highway lane
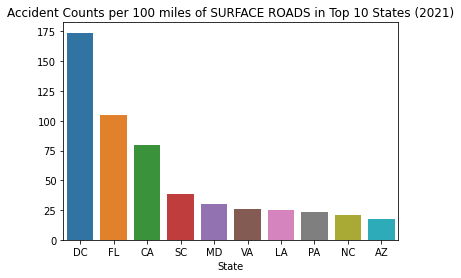 Accidents per 100 miles of surface street lane
DC leads both. South Carolina ranks significantly worse for surface streets than highways. New Jersey ranks poorly for highway accidents but doesn’t crack the top 10 for surface streets — who gets off the highway in Jersey?
Full rankings across all categories:
| State | Total Events | Accidents Hwy | Accidents Road | Construction Hwy | Construction Road | Federal Funding |
|---|---|---|---|---|---|---|
| DC | 1 | 1 | 1 | 1 | 2 | 15 |
| FL | 2 | 3 | 2 | 4 | 3 | 9 |
| AZ | 3 | 15 | 10 | 30 | 1 | 12 |
| CA | 4 | 2 | 3 | 11 | 11 | 1 |
| NY | 5 | 11 | 11 | 10 | 4 | 2 |
| DE | 6 | 12 | 14 | 2 | 5 | 38 |
| PA | 7 | 14 | 8 | 3 | 6 | 8 |
| MD | 8 | 5 | 5 | 23 | 10 | 10 |
| NJ | 9 | 6 | 16 | 8 | 9 | 4 |
| CT | 10 | 4 | 18 | 6 | 14 | 16 |
| VA | 11 | 7 | 6 | 15 | 12 | 19 |
| CO | 12 | 29 | 36 | 5 | 8 | 22 |
| OR | 13 | 8 | 15 | 7 | 23 | 23 |
| LA | 14 | 18 | 7 | 9 | 16 | 27 |
| SC | 15 | 9 | 4 | 18 | 42 | 32 |
| IL | 16 | 36 | 26 | 25 | 7 | 3 |
| IN | 17 | 26 | 30 | 12 | 13 | 13 |
| TX | 18 | 24 | 13 | 19 | 18 | 6 |
| MN | 19 | 10 | 19 | 29 | 24 | 11 |
| WA | 20 | 21 | 23 | 17 | 19 | 5 |
| UT | 21 | 13 | 17 | 31 | 28 | 24 |
| NC | 22 | 17 | 9 | 36 | 35 | 20 |
| RI | 23 | 19 | 33 | 21 | 22 | 35 |
| ID | 24 | 32 | 22 | 22 | 20 | 41 |
| MI | 25 | 27 | 21 | 45 | 15 | 21 |
| AR | 26 | 30 | 31 | 14 | 30 | 36 |
| MA | 27 | 38 | 38 | 32 | 17 | 7 |
| GA | 28 | 25 | 35 | 27 | 26 | 14 |
| TN | 29 | 16 | 12 | 46 | 41 | 25 |
| MT | 30 | 20 | 20 | 20 | 45 | 44 |
| WY | 31 | 40 | 45 | 24 | 36 | 48 |
| OH | 32 | 43 | 29 | 28 | 25 | 18 |
| ME | 33 | — | 48 | 37 | 21 | 39 |
| NM | 34 | 39 | 43 | 13 | 37 | 31 |
| NV | 35 | 31 | 32 | 16 | 43 | 28 |
| OK | 36 | 45 | 27 | 26 | 34 | 33 |
| WV | 37 | 22 | 25 | 33 | 38 | 43 |
| AL | 38 | 23 | 28 | 39 | 40 | 29 |
| WI | 39 | 46 | 47 | 40 | 29 | 26 |
| IA | 40 | 33 | 34 | 44 | 31 | 34 |
| KY | 41 | 41 | 44 | 38 | 32 | 30 |
| VT | 42 | — | 46 | 48 | 27 | 49 |
| NH | 43 | 44 | 42 | 35 | 33 | 46 |
| KS | 44 | 35 | 40 | 34 | 39 | 37 |
| MO | 45 | 28 | 24 | 43 | 46 | 17 |
| MS | 46 | 34 | 37 | 41 | 44 | 40 |
| SD | 47 | 47 | 49 | 42 | 48 | 45 |
| NE | 48 | 42 | 41 | 47 | 47 | 42 |
| ND | 49 | 37 | 39 | 49 | 49 | 47 |
Some interesting observations:
- Arizona has a ton of surface street construction, but ranks 30th for highway construction. Makes sense for a state with newer infrastructure.
- Pennsylvania ranks #3 for highway construction despite being a mid-size state. Fix your bridges, PA.
- Kudos to Texas for ranking highly in total events but NOT making the top 10 for accidents or construction per 100 miles.
3. Does accident frequency correlate to construction frequency?
Correlation matrix (1 = perfectly correlated, 0 = no correlation):
| Total Events | Accidents Hwy | Accidents Road | Construction Hwy | Construction Road | Federal Funding | |
|---|---|---|---|---|---|---|
| Total Events | 1 | 0.802 | 0.875 | 0.721 | 0.914 | 0.345 |
| Accidents Hwy | 0.802 | 1 | 0.835 | 0.673 | 0.535 | 0.451 |
| Accidents Road | 0.875 | 0.835 | 1 | 0.597 | 0.657 | 0.329 |
| Construction Hwy | 0.721 | 0.673 | 0.597 | 1 | 0.525 | 0.247 |
| Construction Road | 0.914 | 0.535 | 0.657 | 0.525 | 1 | 0.232 |
| Federal Funding | 0.345 | 0.451 | 0.329 | 0.247 | 0.232 | 1 |
Key findings:
- Highway and surface street accidents correlate very strongly (0.835). Accident frequency may be regionally driven — local culture, laws, or driving habits — rather than road type.
- Federal funding doesn’t correlate strongly with anything. I expected highway construction to correlate with federal funding, but it doesn’t.
Summary
Most unpleasant states for driving (normalized by road miles): DC, Florida, California, Arizona, New York, Delaware, Pennsylvania.
Least eventful: The Dakotas, Nebraska, Mississippi, Missouri.
A correlation above 0.5 between accidents and construction is enough evidence for me that there’s a real relationship worth investigating further — especially for highway planners.
Here’s to hoping Pennsylvania gets those highways repaired!
— Rocco Panella, May 5, 2022