Covid-19 Research for Ohio
First published: May 17, 2020 Ohio plots added: May 31, 2020
Summary
I am trying to put together some notes and resources regarding the potential risks of Covid-19. As the United States begins to roll back stay-at-home orders and business closures, I would like to have a data-driven understanding of what the realistic risks are to my family. The primary questions I am trying to answer are:
- What are the chances of illness/death from Covid-19 relative to baseline levels of risk from other related causes, such as flu, pneumonia, or other maladies?
- If someone in my family is exposed to Covid-19, what are the chances that they will be infected? Suffer symptoms?
Useful resources I found
- Ohio Covid-19 Dashboard. Ohio published better data than most states, and luckily includes age information.
- Yearly Mortality rates from Flu, Pneumonia, and related illnesses.
- New York City deaths from Covid
- Covid antibodies present in 21% of New Yorkers
- Ohio demographic statistics
- New York Demographics
- I can only trust myself at this point. — Nice article on making decisions based on imperfect data.
1. What is the risk from Covid relative to other illnesses?
I have found this question to be very hard to answer. Due to how society shifted over those few months, I do not think it is possible or worthwhile to try and perform an apples-to-apples comparison of Covid vs influenza or pneumonia risk.
On average, the CDC states that about ~150,000 people in the US per year die from influenza, pneumonia, and related illnesses. While this is greater than the fatality levels from Covid at the time, I cannot answer how stay-at-home orders affected the potential Covid death rates. This is why I moved on to my second question.
2. Assuming I or a family member gets Covid-19, what might I expect to happen?
This is a much better question because it assumes the worst. If you decide to stop self-isolating, you should assume that at some point you will contract Covid-19. So, what happens if you DO contract it?
New York City estimated that about 20% of its population had virus antibodies. Combined with known hospitalization and death counts by age group, we can calculate risk factors.
Assuming 20% of NYC’s ~8 million population (~1.6 million people) contracted Covid-19, and that this infection rate was roughly evenly distributed across age groups:
| Age Group | Total Infections (est.) | Confirmed Cases | Hospitalizations | Deaths | Rate of Confirmation | Rate of Hospitalization | Rate of Death |
|---|---|---|---|---|---|---|---|
| 0-17 years | 430,690 | 6,090 | 514 | 9 | 1.41% | 0.12% | 0.0021% |
| 18-44 years | 644,226 | 66,080 | 7,199 | 593 | 10.26% | 1.12% | 0.09% |
| 45-64 years | 339,168 | 56,838 | 14,017 | 2,908 | 16.76% | 4.13% | 0.86% |
| 65-74 years | 98,959 | 16,662 | 7,915 | 2,775 | 16.84% | 8.00% | 2.80% |
| 75+ years | 88,613 | 17,943 | 11,213 | 6,219 | 20.25% | 12.65% | 7.02% |
The rightmost three columns are the most noteworthy: they say “If someone contracts Covid-19, what are the chances they will show symptoms, be hospitalized, or pass away?”
Adjusting for pre-existing conditions (NYC also tracked how many cases had complicating pre-existing conditions):
| Age Group | % Without Pre-existing Conditions | Rate of Symptoms | Rate of Hospitalization | Rate of Death |
|---|---|---|---|---|
| 0-17 years | 33.33% | 0.47% | 0.04% | 0.001% |
| 18-44 years | 2.83% | 0.29% | 0.03% | 0.003% |
| 45-64 years | 2.11% | 0.35% | 0.09% | 0.018% |
| 65-74 years | 0.13% | 0.02% | 0.01% | 0.004% |
| 75+ years | 0.03% | 0.01% | 0.00% | 0.002% |
Overall, hospitalization rates are fairly low — roughly 3 in 10,000 for the 18-44 age group.
Ohio Data Visualizations
By pulling raw data from the Ohio Covid dashboard, I made some quick plots of age-related Covid data for the entire state. Ohio’s population is about 11 million, with about 60% under the age of 40 (median age: 36).
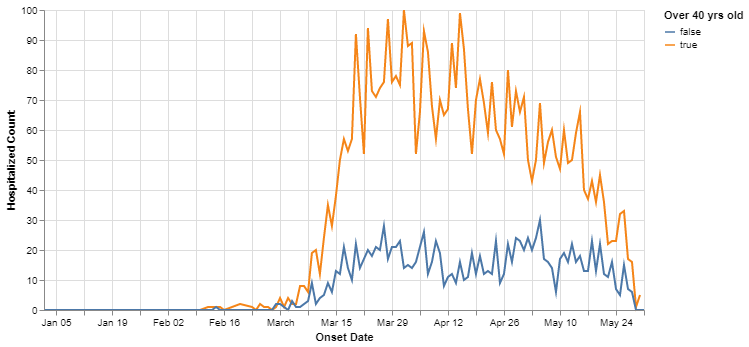
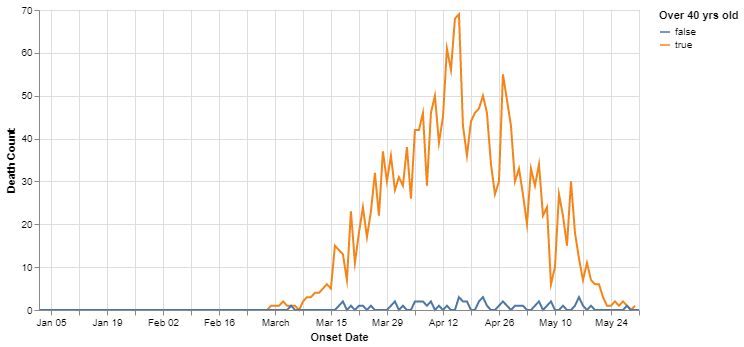
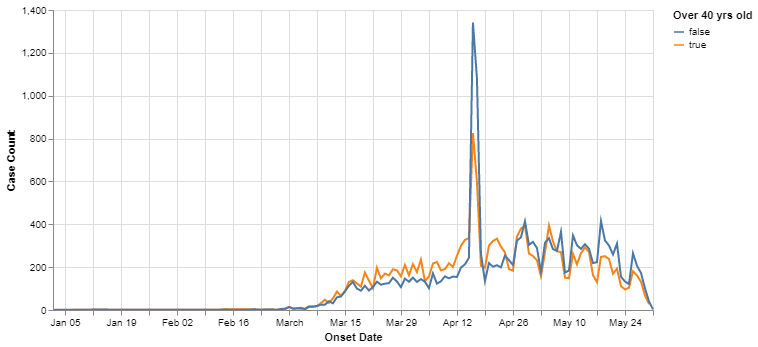
Hospitalizations and deaths trend heavily towards older Ohioans. Case count is close across age groups, but it is difficult to use as a metric since it is largely driven by testing availability.
You can also explore the interactive Ohio Covid dashboard.